Reports & analytics
What management reads: the analytics page and its exports, scheduled progress reports, the PDFs each module prints; and the record-of-the-asset modules that outlive construction — map, digital twin, assets & O&M, spaces, sensors.
Related: Field › Progress · Roles › Management / Reporting · Automation · Glossary
Analytics and exports
What it does
Live project metrics — issue velocity, RFI response, clash trend, capture cadence, progress S-curve, trade interfaces, high-risk zones, team activity — plus every export: the bilingual Progress report PDF, a full workbook, and CSV/XLSX feeds for Power BI or any external BI.
Who uses it and why
Project managers, directors and clients; BI analysts who feed a dashboard.
Prerequisites
Any project role (read). For the BI feeds: a workspace API key with Read scope.
Step-by-step
- Rail › Analytics. Read the KPIs: Elements · Models (ready/total) · Open issues · Critical · Avg resolution · Open RFIs · Clashes (resolved / total) · Photos.
- Insights — anomalies detected this week: press Scan now; a card such as "Issue-rate spike — 3 this week vs ~0.5 baseline (z 2.1)" offers View in analytics, Ack and Dismiss.
- Read the charts: Issue velocity — opened vs closed per week, Captures per week, Progress S-curve — overall % completion over time, Clashes detected per week, Problematic trade interfaces, High-risk zones, Team activity (actions, 120 days).
- Export: Progress report PDF (bilingual), Download workbook, and per register issues / rfis / clashes / photos as CSV or XLSX.
- For an external BI tool, create a key under Workspace settings › API keys and pull
GET /api/feed/issues?format=csv(also/rfis,/clashes,/photos,/projects) with headerX-Api-Key: bz_…. - To email the progress PDF on a cadence: Project settings › Scheduled reports — Cadence (Weekly / Monthly), Language (English + Arabic / English / العربية), Active ("Delivering"), Recipients (comma or newline separated) ("recipients can be external clients; no BimZone account needed"), Save schedule.
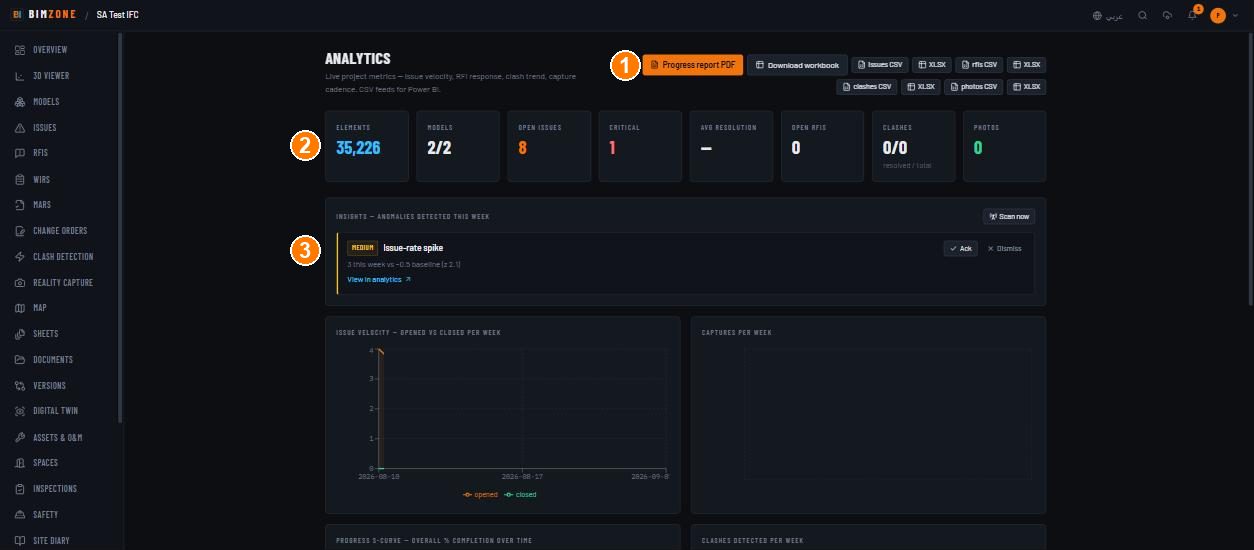
1 · exports (Progress report PDF, workbook, CSV/XLSX per register) · 2 · KPI tiles · 3 · anomaly insights
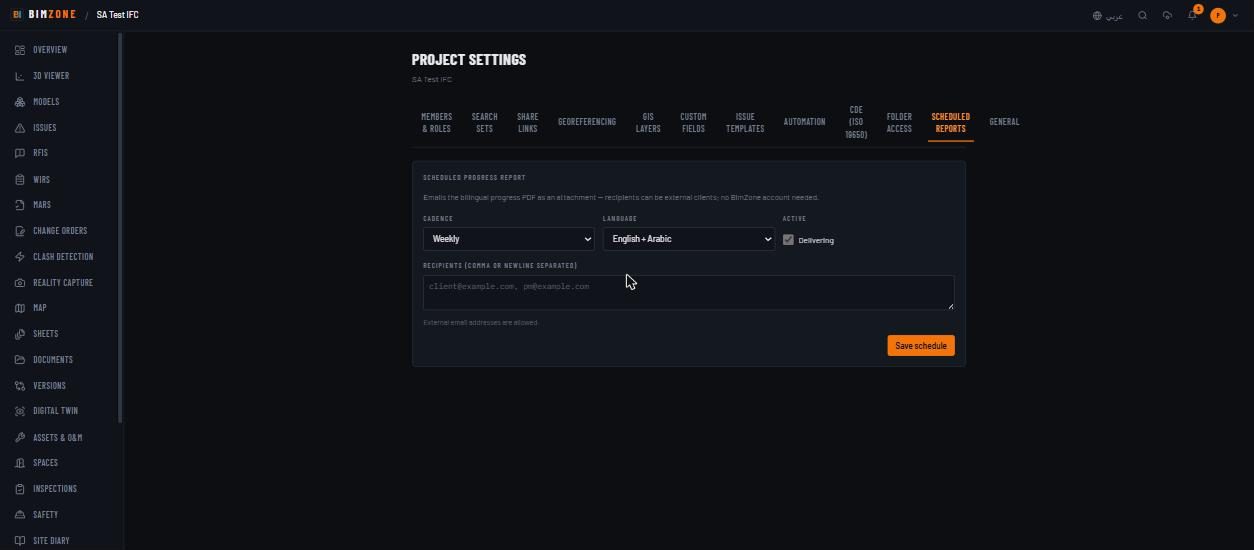
Controls
Exports row · KPI tiles · Scan now · anomaly cards (View in analytics, Ack, Dismiss) · charts · Scheduled reports form.
Other report outputs, by module: Punch list (Inspections), transmittal Cover sheet (Documents › Transmittals), version-comparison PDF (Versions), Export BOQ (Takeoff), Export COBie (Assets), Export CSV (Spaces), BCF export (Issues, Clash tests), portfolio CSV / Excel (Dashboard), Access review › Export CSV (Workspace).
What happens after
Anomaly acknowledgements are recorded; the sidebar badge counts open high/critical anomalies. Scheduled reports send on the cadence to every recipient; failures are logged server-side and the schedule stays active.
Connections to other modules
Everything feeds it. Anomalies can trigger Automation (anomaly.raised).
Data in / data out
In: nothing (read model). Out: PDF, XLSX workbook, CSV/XLSX per register, API feeds.
Permissions and approval
Read and export: every role. Scheduled reports: Admin. API keys: workspace admin.
Common mistakes and troubleshooting
- Progress S-curve is flat — no progress snapshots; run Progress › Recompute and Capture snapshot.
- PDF is in the wrong language — the PDF follows the UI language toggle (or the schedule's Language setting).
- Scheduled email never arrives — the deployment's SMTP is not configured or the address bounced;
operators see
[report-schedule] delivery failedin the worker log. - Feed returns 401 — the key was revoked or lacks Read scope; keys are shown once at creation.
Limitations and integration prerequisites
- Feeds are pull-only CSV/JSON; there is no push to Power BI.
- Email delivery requires SMTP on the server (
SMTP_*variables).
Where to go next
Map & GIS
What it does
A MapLibre map of the project: the georeferenced model footprint, issue / photo / asset / inspection / point-cloud markers, and GIS overlays (GeoJSON or zipped shapefiles) — with offline tile caching for the field.
Who uses it and why
Site and infrastructure teams; anyone locating records geographically.
Prerequisites
Project settings › Georeferencing with a saved origin. Optional: GIS layers uploaded under Project settings › GIS layers.
Step-by-step
- Settings › Georeferencing: Prefill from IfcSite (reads RefLatitude / RefLongitude from the first IfcSite element) or type Origin latitude / longitude, Origin altitude, Rotation from true north ("Clockwise degrees from true north to +X axis"), Scale ("Local metres → geographic metres (default 1.0 for IFC metres)"). Save georeferencing. The axis note applies: "+X = East, -Z = North, +Y = Up (metres). Origin = model (0, 0, 0)."
- Settings › GIS layers: File (.geojson, .json, or .zip shapefile), Name (optional), Kind (Parcels · Utilities · Roads · Boundary · Custom), Color, Upload layer. Layers overlay the map and the 3D viewer.
- Rail › Map. Switch STREETS / SATELLITE / BLANK; the legend explains marker colours (issue · photo · asset · inspection · pointcloud). Click a marker to open the record; click a layer feature for its properties.
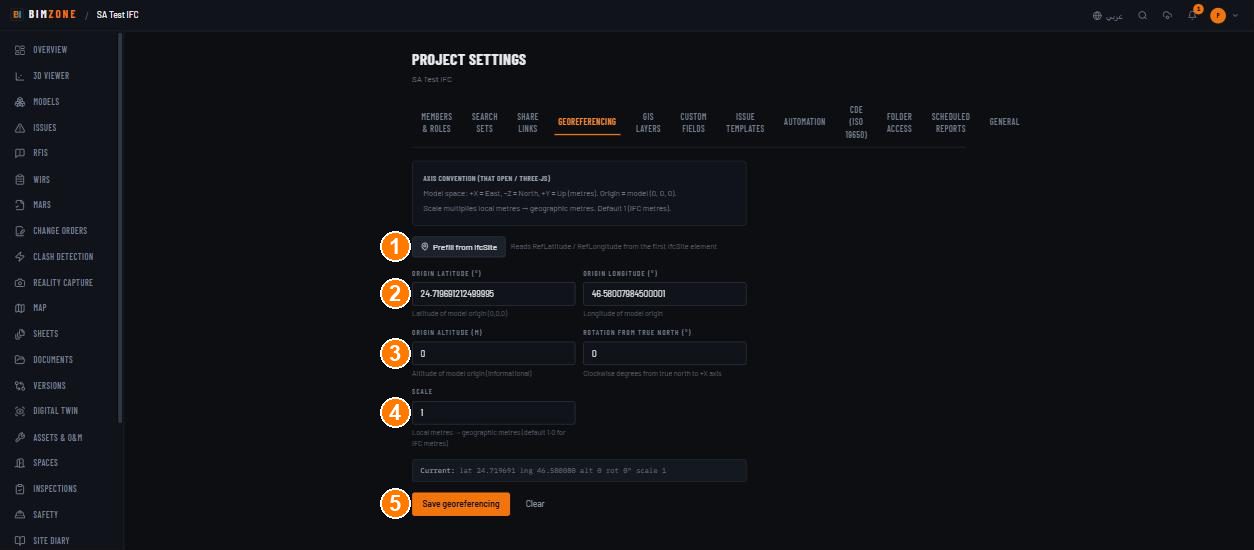
1 · Prefill from IfcSite · 2 · origin latitude / longitude · 3 · altitude and rotation · 4 · scale · 5 · Save georeferencing
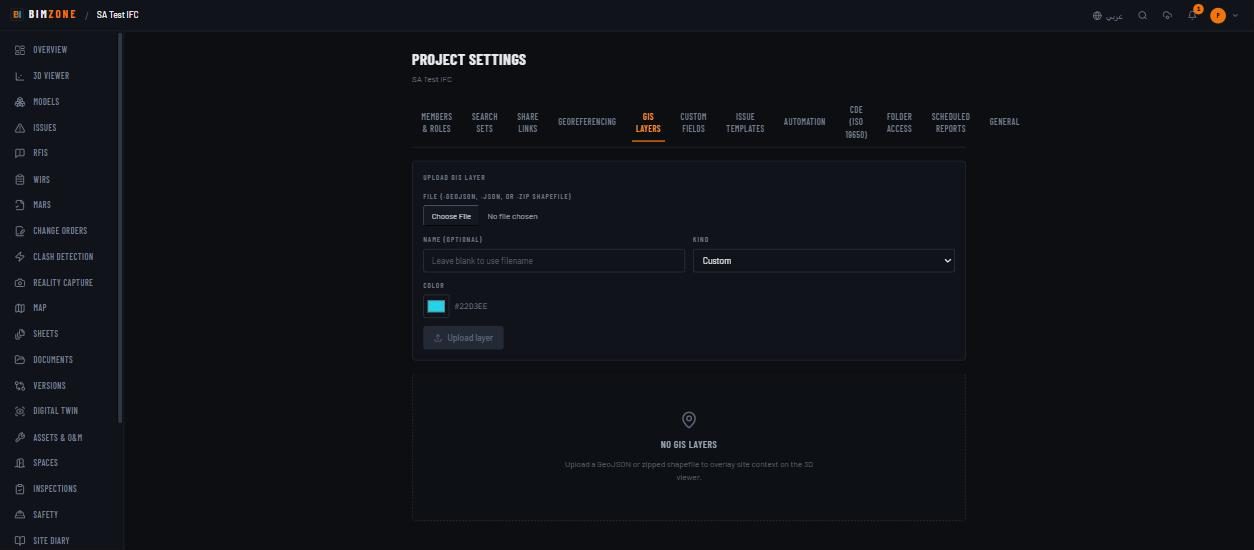
Controls
Basemap STREETS / SATELLITE / BLANK · legend · markers · GIS layer list (Layers, Zoom to layer, feature Properties) · in the viewer: Coordinate marker — click the model to drop a georef pin.
What happens after
Tiles you have viewed are cached in the browser (Cache API) so a previously visited area still renders offline; layers persist to the project.
Connections to other modules
Viewer (GIS overlays, coordinate marker), Reality Capture (GPS auto-pinning uses the georeference), Issues / Assets / Inspections (markers).
Data in / data out
In: origin, GeoJSON / shapefiles. Out: none.
Permissions and approval
Georeferencing and GIS layers: Admin. Map: everyone.
Common mistakes and troubleshooting
- Map zoomed out to the whole world — the model footprint and the origin are far apart because the IFC uses survey coordinates (the model's local origin is not at 0,0,0). Set the origin to the model's actual local origin, or re-export the IFC with a local origin near the site.
- "No georef — set origin in Project settings" (viewer coordinate marker) — save a georeference.
- Layer upload rejected — "Upload shapefiles as a .zip containing .shp + .dbf + .prj"; a bare
.shpis refused, and so is an archive that inflates past the server's size guard.
Limitations and integration prerequisites
- Basemaps come from OpenStreetMap and Esri World Imagery (the server's CSP allows exactly those hosts; an operator adding another basemap must extend it — see the deployment runbook).
- No CRS transformation beyond origin + rotation + scale.
Where to go next
Digital twin
What it does
A triple view: site reality (the nearest 360° capture) ↔ the construction model ↔ the design model, with synchronised selection, camera lock and a risk lens.
Who uses it and why
Construction managers comparing as-built to design; handover teams.
Prerequisites
Two READY models to compare (or one used as both); 360° captures for the reality panel.
Step-by-step
- Rail › Digital Twin. Choose Construction:
and Design: . - Select an element in either model panel: the other panel syncs, and 1 · Site reality shows the closest site photo ("Select an element in either model panel to surface the closest site photo.").
- LOCK ties the two cameras; RISK overlays the risk lens.
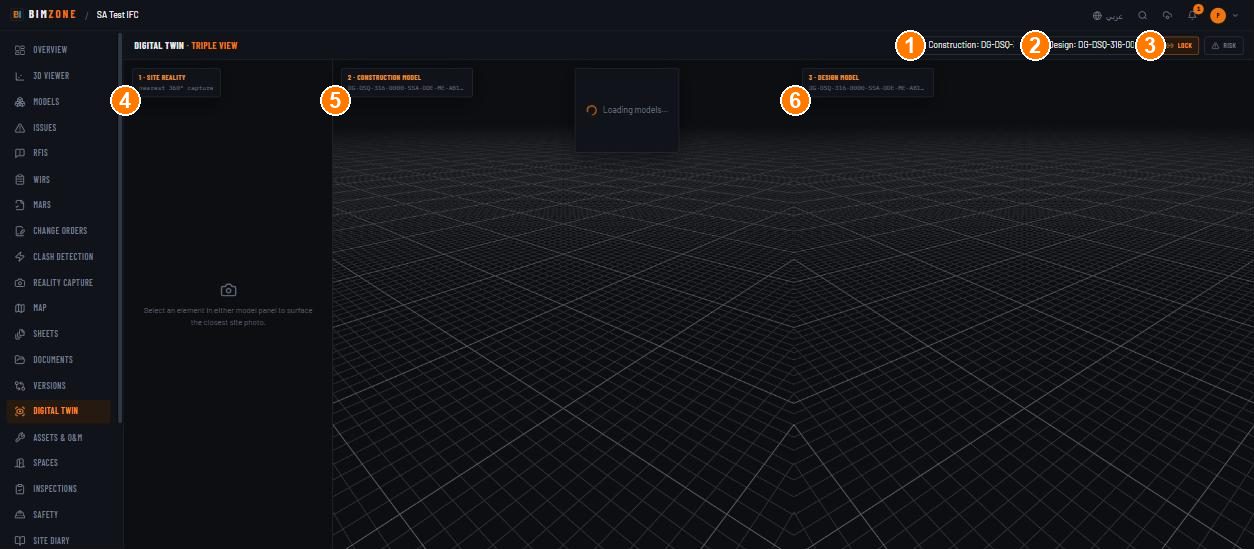
1 · Construction model select · 2 · Design model select · 3 · LOCK / RISK · 4 · Site reality · 5 · Construction model · 6 · Design model
Controls
Construction / Design selects · LOCK · RISK · three panels.
What happens after
Nothing is written; it is a comparison surface.
Connections to other modules
Models, Reality Capture, Issues (risk lens reads issue risk).
Data in / data out
None.
Permissions and approval
Everyone.
Common mistakes and troubleshooting
- "Digital twin needs a model" — upload one.
- Site reality stays empty — no 360° captures near the selected element.
Limitations and integration prerequisites
The reality panel uses 360° photos only (no point-cloud diffing).
Where to go next
Assets & O&M
What it does
The post-closeout living facility record: assets registered on model elements with serials, warranty, maintenance interval and condition; a maintenance calendar generated from intervals; Generate assets from model; Export COBie; and Planon push/pull when connected.
Who uses it and why
Handover and FM teams; owners' operations staff after closeout.
Prerequisites
A READY model. Role Admin to register assets.
Step-by-step
- Rail › Assets & O&M › Register asset: Model element (search "AHU, pump, door…"), Asset tag (AHU-L3-01), Manufacturer, Model number, Serial number, Install date, Warranty expiry, Maintenance interval (days), Condition, Notes. Or Generate assets from model to create one per qualifying element in bulk.
- Maintenance calendar tab: "Set a maintenance interval on an asset and tasks will appear here automatically."
- Export COBie for the handover deliverable.
- With a Planon connection (Integrations), assets and spaces push/pull.
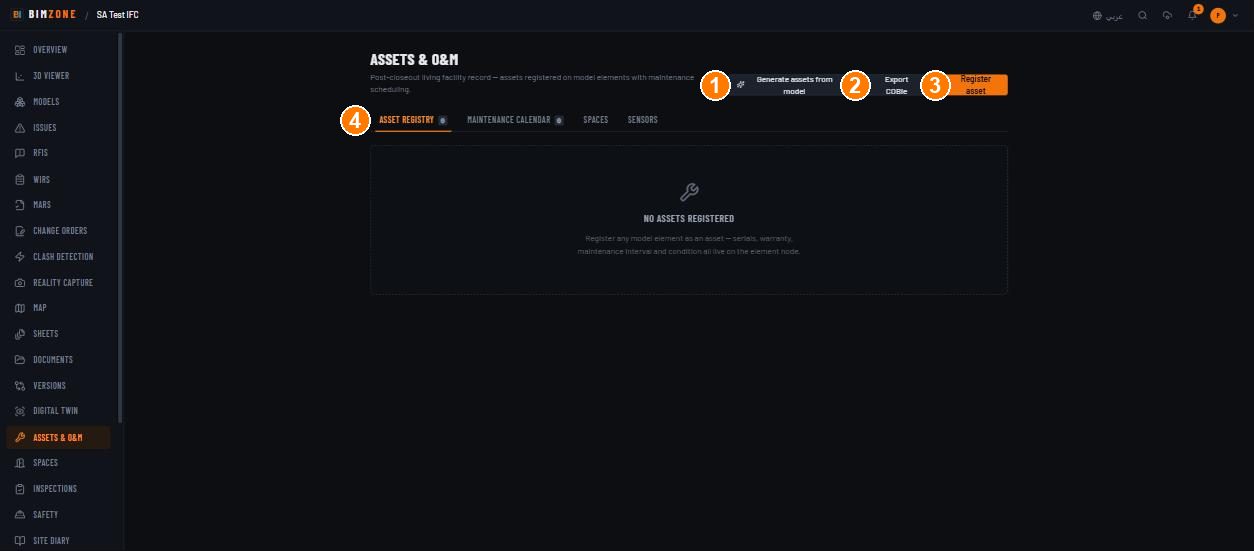
1 · Generate assets from model · 2 · Export COBie · 3 · Register asset · 4 · Asset registry / Maintenance calendar / Spaces / Sensors tabs
Controls
Generate assets from model · Export COBie · Register asset · tabs Asset registry · Maintenance calendar · Spaces · Sensors · per asset: edit, condition, element link.
What happens after
Assets live on the element node (the element panel's Asset chip); maintenance tasks appear on the calendar; COBie is generated from the register.
Connections to other modules
Viewer, Spaces, Sensors, Integrations (Planon), Map (asset markers).
Data in / data out
In: asset fields. Out: Export COBie (an .xlsx workbook).
Permissions and approval
Register/edit: Admin. Generate from model and attach asset documents: Admin, Upload Engineer. Export COBie: everyone. Read: everyone.
Common mistakes and troubleshooting
- Generate created nothing — the model has no elements of the kinds the generator recognises; register manually.
- Calendar empty — no asset has a maintenance interval.
Limitations and integration prerequisites
COBie export covers the register's fields; Planon needs its own connection and base URL.
Where to go next
Spaces
What it does
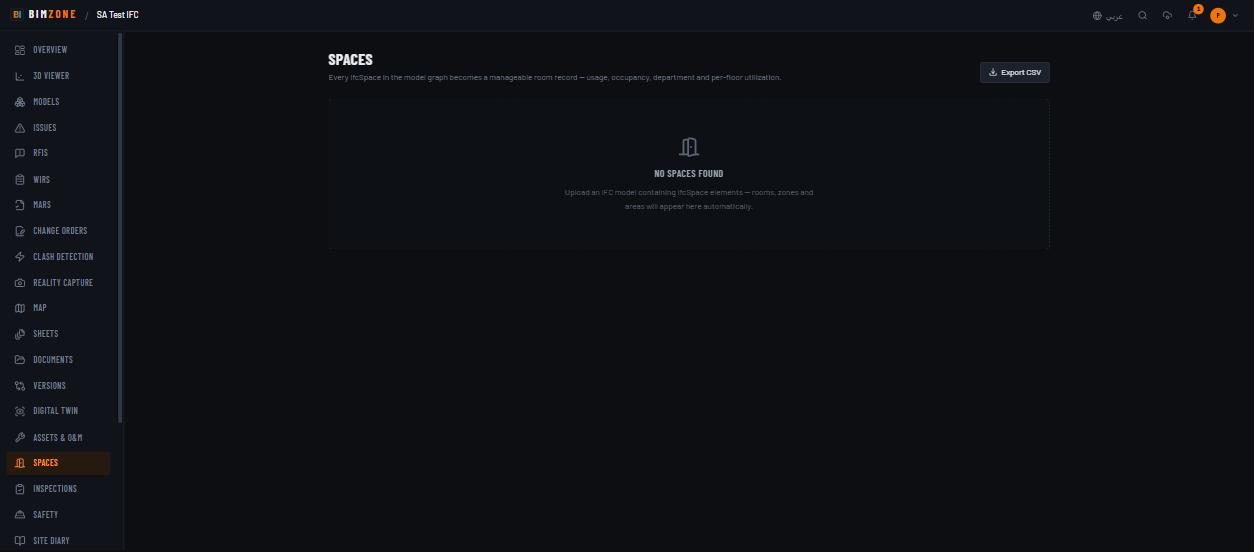
Every IfcSpace in the model graph becomes a manageable room record — usage, occupancy, department and per-floor utilisation — with CSV export.
Who uses it and why
Space planners and FM.
Prerequisites
An IFC containing IfcSpace elements ("rooms, zones and areas will appear here automatically").
Step-by-step
- Rail › Spaces. Filter by Floors (All floors). Open a space to set Usage, Occupancy (people), Department, Area override (m²), Notes.
- Export CSV.
Controls
Floor filter · table (Space · Floor · Area m² · Usage · Occupancy · Department) · space drawer · Export CSV.
What happens after
Space attributes persist on the element node.
Connections to other modules
Models, Assets (Spaces tab), Sensors (a sensor can be bound to a space).
Data in / data out
In: attributes. Out: CSV.
Permissions and approval
Edit: Admin. Read and export: everyone.
Common mistakes and troubleshooting
- "No spaces found" — the IFC has no IfcSpace elements; ask the modeller to export rooms.
Limitations and integration prerequisites
None.
Where to go next
Sensors & IoT
What it does
Receives device readings from a gateway, charts them, binds sensors to elements or spaces, and turns threshold breaches into anomalies that surface on Analytics and can trigger automation.
Who uses it and why
Facility and O&M teams; gateways post unattended.
Prerequisites
A workspace API key with Write scope for the gateway. Role Admin or Upload Engineer to add thresholds; Admin to decommission.
Step-by-step
- The gateway POSTs readings to
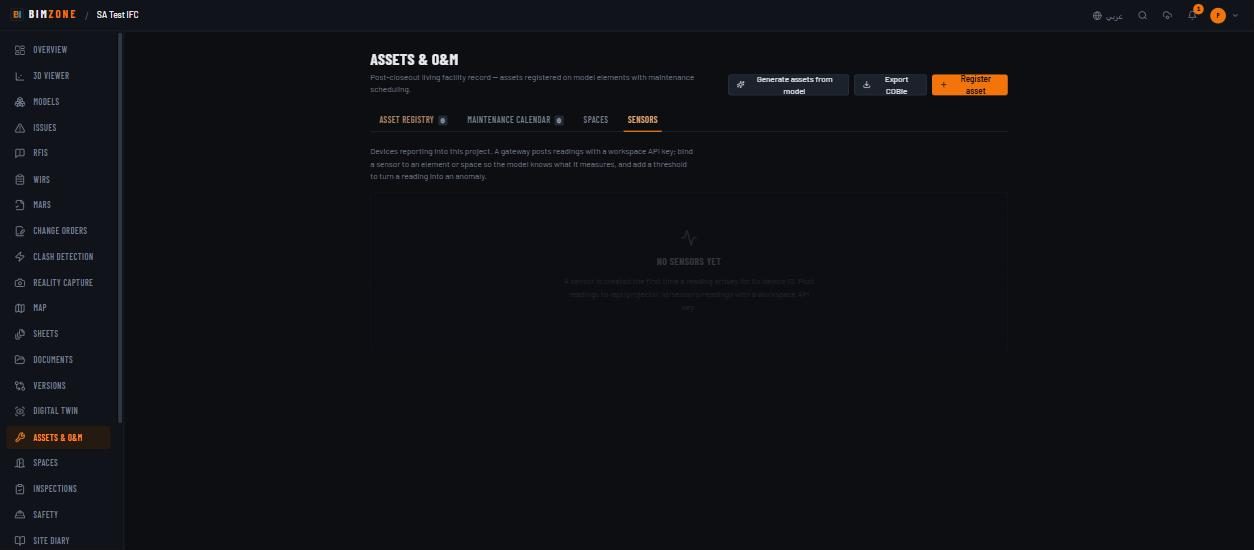
/api/projects/:id/sensors/readingswithX-Api-Key. "A sensor is created the first time a reading arrives for its device ID." - Assets & O&M › Sensors: the table (Sensor · Device ID · Kind · Latest · Last seen · Binding). Open one: Kind … · unit …, Range (24 h / 7 d / 30 d), the series.
- Add threshold: When the reading is (greater than · at least · less than · at most), Value, Severity (Low · Medium · High · Critical), and how many consecutive readings must breach. "No thresholds — readings are recorded but nothing is watching them."
- Bind the sensor to an element or space so the model knows what it measures.
- Retire a device with Decommission — it deletes the device, its readings and thresholds but keeps any anomalies it already raised.
Controls
Table · sensor detail (Range, series, Thresholds, Add threshold, remove threshold, binding, Decommission).
What happens after
A breach raises an anomaly (anomaly.raised), counted on the Analytics badge and available to
Automation rules. Rejected readings (future timestamps, bad values) are reported in the ingest
response rather than dropped silently.
Connections to other modules
Analytics (anomalies), Automation, Assets, Spaces.
Data in / data out
In: readings via API. Out: anomalies; series in the UI.
Permissions and approval
Ingest: API key with Write (or a signed-in member with upload rights). Thresholds and binding: Admin, Upload Engineer. Decommission: Admin.
Common mistakes and troubleshooting
- A test device became a permanent row — it is created by its first reading; Decommission it.
- "Nothing in this window" — no readings in the selected range; try a longer one.
- Empty bucket in the chart — drawn as a gap, not zero.
Limitations and integration prerequisites
No MQTT/OPC-UA listener — the gateway must POST HTTP.